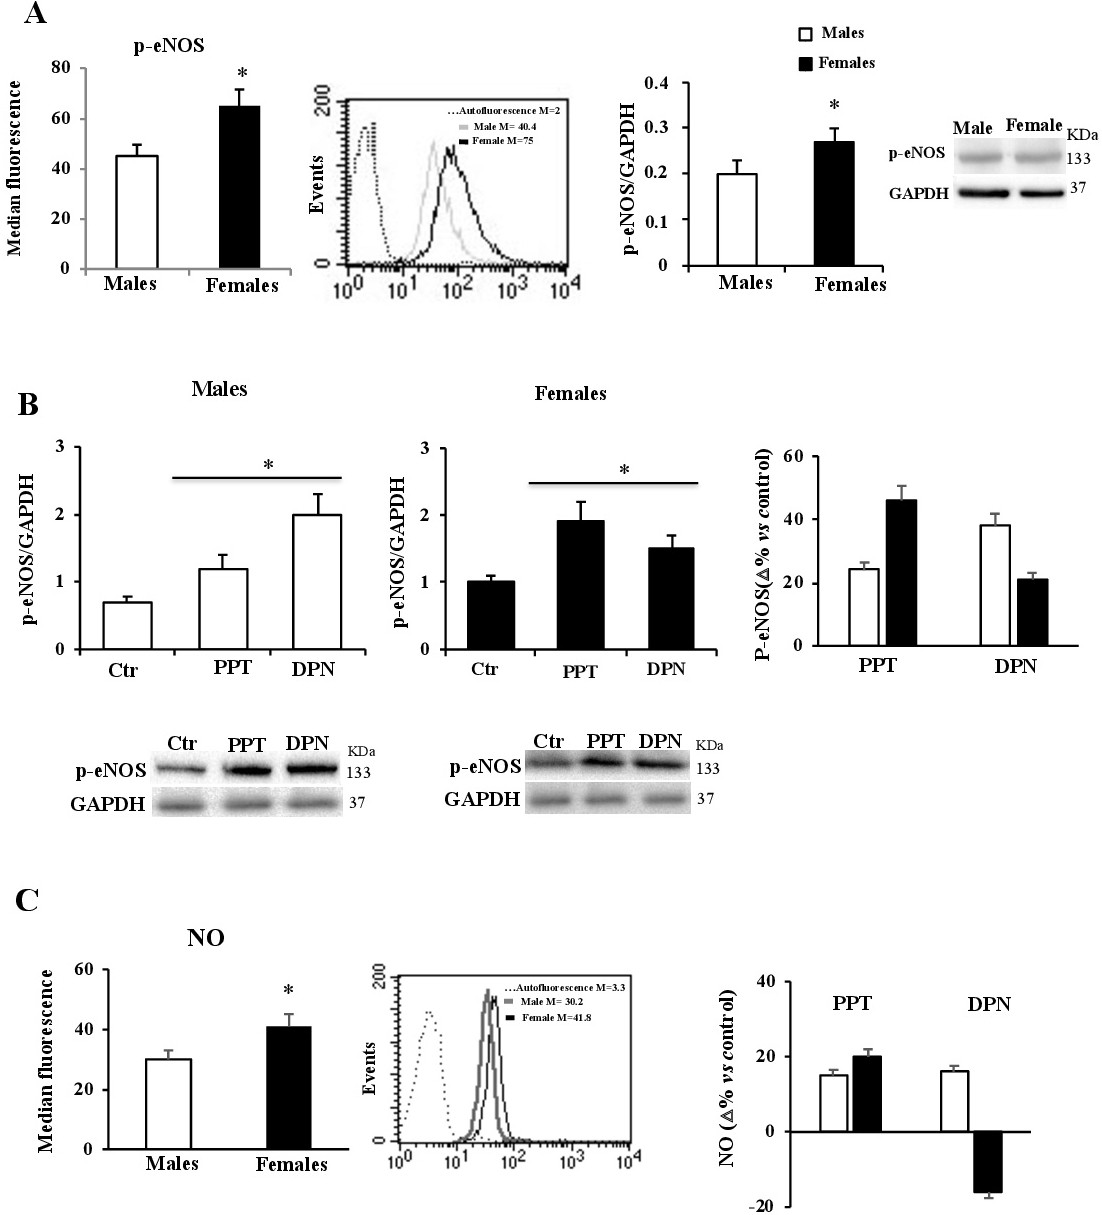
Fig. 5. RBC eNOS phosphorylation and NO production. (A, left panel) Cytometric analysis of phosphorylated eNOS (p-eNOS). (A, middle panel) Dot plot showing p-eNOS in RBCs from a representative male and a representative female. (A, right panels) Western blotting analysis of p-eNOS. The content of p-eNOS were significantly (p<0.05) higher in RBCs from females than in those from males. (B, left and middle panels) Western blotting and densitometry analysis of p-eNOS. Representative blotting normalized for the GAPDH. Histograms show the densitometry analysis of three different experiments. Note that p-eNOS content significantly increased after treatment with ER-α agonist (PPT) and ER-β agonist (DPN) in both male and female RBCs. (B, right panel) Cytometric analysis of p-eNOS after treatment with PPT and DPN. The cytometric data are the average of △% (treated vs controls). (C, left panel) Cytometric analysis of NO levels. The histogram numbers are the median values of fluorescence intensity. (C, middle panel) Dot plot showing NO levels in RBC from a representative male and a representative female. (C, right panel) Cytometric analysis of NO levels after treatment with ER agonists. The cytometric data are the average of △% (treated vs controls). Note: i) a significant (p<0.05) gender difference in NO levels; ii) both ER-α and ER-β were involved in NO production in RBCs from males; iii) only ER-α was involved in NO production in RBCs from females. * p<0.05.